
You are using an out of date browser. It may not display this or other websites correctly.
You should upgrade or use an alternative browser.
You should upgrade or use an alternative browser.
Tech Level 8 Solar System
- Thread starter Tom Kalbfus
- Start date
Tom Kalbfus said:Six Squares along the Y axis, five squares along the X axis (6^2 + 5^2)^0.5 = 7.81 * 10,000,000 miles = 7,810,000 miles = 12,569,000 km is the distance
A Scout ship accelerates a 1-G for 7 hours using 10% of its hull volume in reaction mass. 9.8 m/s * 7 * 60 * 60 seconds = 246.96 km/sec. Traveling at an average speed of 123.48 km/sec for the first 7 hours of the trip and the last, the ship travels 6,223,392 during the acceleration phase of the trip for a total of 14 hours using 20% of the ships's hull volume in reaction mass. That leaves 6,345,608 km to travel at cruise velocity of 246.96 km/sec, this takes 25,694.9 seconds or 7.14 hours for a total trip time of 21.14 hours to go from Earth to Mars, since the planets don't move much in less than 4 days on this map, they can be assumed to hold position, and the orbital velocities compared to the speed of the space ship is trivial, so we just ignore that.
So you're really only using them to measure the distance between the worlds, but your acceleration and deceleration can be held for so long that the planets don't move in their orbits. And you're assuming a straight line path between the planets.
What if Mars is on the other side of its orbit? What about gravitational slingshots from the sun or other bodies? How would you calculate Hohmann Transfer orbits if you didn't want to use up all of that reaction mass?
According to your chart with its unrealistically curcular orbits, the furthest that Earth and Mars would get is 240 million miles (ugh. filthy Imperial units). The closest they'd get is more like 60 million miles (though it can actually get as close as 35 million miles). At furthest approach (ignoring things like the Sun in the way and gravitational slingshots around it) your ship would have a cruise of 11 days (+14 hours for the accel/decel phases), which again wouldn't really be enough for Mars to move in its orbit.
It seems to me that you'd be better off just determining the closest and furthest approaches and calculating travel times from that (which you don't need this kind of chart for at all), and travel at any other time is between those values.
Tom Kalbfus
Mongoose
It is fairly easy to, each planet or moon has an orbital period, the locations on these maps are their starting positions, which we'll arbitrarily define as their positions on January 1, 2163 at the stroke of midnight Greenwich Mean Time. Now I didn't bother to calculate these positions using actual data, I just placed he planets and moons at random positions in their orbits, with considerations towards, having room to put their names, near their spots so they could be clearly labeled unambiguously. Divide 360 degrees by their orbital period in days, and the answer is the number of degrees each planet or moon advances in a day, then you have to decide how many days it takes each planet or moon to advance out of its square at the given scale on the map, to the next square in its orbit. There are ways to do this using trigonometry. I assume the orbits are circular to make this calculation easy. Find the position of each planet, note the coordinates X-axis and Y axis. Divide the X coordinate in squares by the radius in squares, that is the cosine of how many degrees the planet is in its orbit from the positive X axis. Find the degrees of each planet and moon, add the degrees each planet advances each day to the starting position and find out how many days it takes before the planet or moon ends up in the next square. Radius times the cosine of the angle is your X coordinate on this map, and Radius times the sine of the angle is your Y coordinate on the map for the object in question.Sketchy said:Thanks for your posts Tom!
Your charts assume the planets location at a certain point in time when movement starts. Do you ever account for planets locations at other times?
Tom Kalbfus
Mongoose
It is a simplification, I'm assuming the planets all orbit in the same plane, which isn't true, and that they are in circular orbits, which isn't true either, but the calculations you make are much easier when you make these assumptions, and a circle is a fairly good approximation for most of the orbits of these planets, most do not have highly elliptical orbits, unlike comets for example, which usually do have highly elliptical orbits.. Most planets have orbits which look circular to thehuman eye, so its a good enough approximation in most cases. the actual travel time may be a little longer or a little shorter than these estimates, but not by much.fusor said:Tom Kalbfus said:Six Squares along the Y axis, five squares along the X axis (6^2 + 5^2)^0.5 = 7.81 * 10,000,000 miles = 7,810,000 miles = 12,569,000 km is the distance
A Scout ship accelerates a 1-G for 7 hours using 10% of its hull volume in reaction mass. 9.8 m/s * 7 * 60 * 60 seconds = 246.96 km/sec. Traveling at an average speed of 123.48 km/sec for the first 7 hours of the trip and the last, the ship travels 6,223,392 during the acceleration phase of the trip for a total of 14 hours using 20% of the ships's hull volume in reaction mass. That leaves 6,345,608 km to travel at cruise velocity of 246.96 km/sec, this takes 25,694.9 seconds or 7.14 hours for a total trip time of 21.14 hours to go from Earth to Mars, since the planets don't move much in less than 4 days on this map, they can be assumed to hold position, and the orbital velocities compared to the speed of the space ship is trivial, so we just ignore that.
So you're really only using them to measure the distance between the worlds, but your acceleration and deceleration can be held for so long that the planets don't move in their orbits. And you're assuming a straight line path between the planets.
Well obviously you have to go around the Sun! I'd say its a two-step process if the planets are on the opposite side of the Sun from each otherWhat if Mars is on the other side of its orbit? What about gravitational slingshots from the sun or other bodies? How would you calculate Hohmann Transfer orbits if you didn't want to use up all of that reaction mass?

Do you see orbit 0 on this chart? Lets suppose You are on Earth, at its current position on the Map, and Venus is at position K in its orbit, the Sun is inbetween, You can't fly through the Sun, but you can plot a course from Earth to a position in Orbit 0 to the side of the Sun, calculate the distance using the Pythagorean formula, and then calculate the second distance from that point to Venus, add the two distances together, and that is the total distance you must travel to go around the Sun and get to Venus from Earth. You could spend 3.5 hours accelerating, and another 3.5 hours decelerating to get to that point in orbit zero, then you do the same to go from that point to Venus. determine the cruise speed inbetween acceleration and deceleleration, determine how much distance you cover during acceleration/deceleration and subtract it from the distance of each leg of the journey, and then divide the remaining distance by the cruise speed. add the travel times for each leg together and you get the total travel time. Assume your average velocity during acceleration to be one half your cruise speed. In this Universe, it is common to travel at 1-g acceleration, as there is no artificial gravity to shield you from the effects of higher acceleration, so even if a spaceship is capable of 2-G acceleration or more, that ship usually accelerates only at 1-G in space, reserving the higher G acceleration for getting off a planet's surface or maneuvering in combat. characters need to be strapped into their acceleration couches and have the controls they need in front of them, if they are to do high G combat maneuvers in space! Another possibility is to use low berths, in which case it doesn't matter how hard the ship accelerates, while in low berths, the passengers don't feel it. Assuming the usual 1 to 6-G range of acceleration. People who want to get somewhere in a hurry, often take low passage in an automated spacecraft.
According to your chart with its unrealistically curcular orbits, the furthest that Earth and Mars would get is 240 million miles (ugh. filthy Imperial units). The closest they'd get is more like 60 million miles (though it can actually get as close as 35 million miles). At furthest approach (ignoring things like the Sun in the way and gravitational slingshots around it) your ship would have a cruise of 11 days (+14 hours for the accel/decel phases), which again wouldn't really be enough for Mars to move in its orbit.
It seems to me that you'd be better off just determining the closest and furthest approaches and calculating travel times from that (which you don't need this kind of chart for at all), and travel at any other time is between those values.
Well the maps are also places to put my space colonies on this map. I have completed all the charts by the way, I just haven't posted them yet. It is time to consider the kind of space colonies I will have. The typical UWP has 8 digits, these usually are Starport, Size, Atmosphere, Hydrographics, Population, Government, Law Level, and Tech level. Since this is tech level 8, I use the codes for spaceports instead: F = A, G = B, H = C, I = D, J = E, and Y = X, the description is the same as in starports, except this is in regard to servicing and fueling of spaceships and not starships with jump drives, since there aren't any jump drives.
In my treatment World would have these codes: Spaceport, Size, Atmosphere, Hydrographics, Population, Government, Law Level, and Tech Level (usually 8)
For artificial space colonies, the first three digits go for a three letter code which describes the type of space colony it is, you can roll dice for the population, and dependent varioable Government and law level, for tech level, just put in an 8 for that last slot! Now for the space colonies:

This is a Stamford Torus, it holds a population of about 10,000 people, so if you population is 4, you get one of these. The letter code for Stamford Torus is TOR.

This is a Double Torus, the letter code is 2TR.

This is a Bernal Sphere, the letter code is SPH

This is the Kalpana Space Colony design, the letter code for this is KAL.

This is an O'Neill Cylinder, the Letter code for this is CYL

This is a double O'Neill Cylinder, the Letter code for this is 2CY That is what I'll use for my space colonies, if you see these letter codes, they are not natural objects! Both kinds of O'Neill Cylinders are 4 miles wide and 20 miles long, and they can hold populations of up to 10 million each.
Population codes for each colony range from 3 to 7, roll 2d6-2 and interpret the results as follows
0 to 3 = population code of 3
4 = population code of 4
5 = population code of 5
6 = population code of 6
7 to 10 = population code of 7
the government and law level digits are modified by the pop digit the same way they are for worlds, the range of population for space colonies is narrower than for worlds, the technology for building space colonies for pop digits 8+ is not there yet, and no one is going to build a colony and leave it empty, there is a minimum population of 3 needed to maintain lie support for each colony, and maintain all the facilities to keep it running, and that population number is 3!, so you aren't going to get a space colony with fewer than 1000 people, maybe a space station, but were not counting those.
Tom Kalbfus
Mongoose
As I promised, here are the final charts of the Solar System.


there you have it. No with my work done, I'm going to start populating this system. These are the forms I'm going to use:


You can grab one if you like an do your own star system, its based on the forms from the Classic Traveller Scout Book, I've added another column of orbit slots to account for satellites orbiting satellites. Otherwise it is much the same, I've eliminated the boxes for writing in letter codes in pencil, since I'm doing it on a computer, but the same idea.
there you have it. No with my work done, I'm going to start populating this system. These are the forms I'm going to use:
You can grab one if you like an do your own star system, its based on the forms from the Classic Traveller Scout Book, I've added another column of orbit slots to account for satellites orbiting satellites. Otherwise it is much the same, I've eliminated the boxes for writing in letter codes in pencil, since I'm doing it on a computer, but the same idea.
Tom Kalbfus
Mongoose

Here are the starting positions of all the space colonies in low Earth orbit, that is an orbit of less than 2500 miles above the surface of the planet, each of these has a population ranging from 1000 to 20,000,000 people. Each colony in the same orbit ring is assumed to be orbiting at the same altitude and at the same rate, so all of them are effectively moving in an orbit track around the Earth. The occurrence rate for colonies per square is 50%, I will reduce this occurrence rate when I do charts further from Earth.
You've done an awesome job, Tom! Working out these charts is a great feat, and I've learned a lot by studying them.
However, as a referee I feel at this point - since the positions of the respective planets, as you indicated, are in effect random - that a die roll based on the respective orbits would suffice for me, and that my players would never know the difference, only that the travel times would seem reasonable and vary from the to time, which is easily explained. I would tweak it, of course, so that travels close in time would be about the same. A die roll chart would really keep the game flowing for me, without having to resort to pausing the game, bring out the right chart and do the calculations, every time travel is called for.
If you could condense this information into a die roll (potentially using multiple dice to get a normal curve) it would really make my day.")
Thanks!
However, as a referee I feel at this point - since the positions of the respective planets, as you indicated, are in effect random - that a die roll based on the respective orbits would suffice for me, and that my players would never know the difference, only that the travel times would seem reasonable and vary from the to time, which is easily explained. I would tweak it, of course, so that travels close in time would be about the same. A die roll chart would really keep the game flowing for me, without having to resort to pausing the game, bring out the right chart and do the calculations, every time travel is called for.
If you could condense this information into a die roll (potentially using multiple dice to get a normal curve) it would really make my day.
Thanks!
Tom Kalbfus
Mongoose
A die roll chart would use 2 six-sided dice to determine the position of each planet in their orbits with the following results:Sketchy said:You've done an awesome job, Tom! Working out these charts is a great feat, and I've learned a lot by studying them.
However, as a referee I feel at this point - since the positions of the respective planets, as you indicated, are in effect random - that a die roll based on the respective orbits would suffice for me, and that my players would never know the difference, only that the travel times would seem reasonable and vary from the to time, which is easily explained. I would tweak it, of course, so that travels close in time would be about the same. A die roll chart would really keep the game flowing for me, without having to resort to pausing the game, bring out the right chart and do the calculations, every time travel is called for.
If you could condense this information into a die roll (potentially using multiple dice to get a normal curve) it would really make my day.
Thanks!
11 = 0 degrees
12 = 10 degrees
13 = 20 degrees
14 = 30 degrees
15 = 40 degrees
16 = 50 degrees
21 = 60 degrees
22 = 70 degrees
23 = 80 degrees
24 = 90 degrees
25 = 100 degrees
26 = 110 degrees
31 = 120 degrees
32 = 130 degrees
33 = 140 degrees
34 = 150 degrees
35 = 160 degrees
36 = 170 degrees
41 = 180 degrees
42 = 190 degrees
43 = 200 degrees
44 = 210 degrees
45 = 220 degrees
46 = 230 degrees
51 = 240 degrees
52 = 250 degrees
53 = 260 degrees
54 = 270 degrees
55 = 280 degrees
56 = 290 degrees
61 = 300 degrees
62 = 310 degrees
63 = 320 degrees
64 = 330 degrees
65 = 340 degrees
66 = 350 degrees
Then you convert polar coordinates to Cartesian coordinates. Each planet has a set of polar coordinates, which consist of the planet's orbital radius, and its angle, which I just showed you how to roll randomly. To get X and Y coordinates, you use the following formulae. X = radius * cos(angle), Y = radius * sin(angle) once you have the X-coordinates and Y-coordinates for both planets, you have the means to determine the distance between both planets with the Pythagorean distance formula Distance = ((X1-X0)^2 + (Y1-Y0)^2)^0.5.
Thanks Tom! However, I meant a die roll for the whole distance so that I don't need to do any (or only minimal) calculations. Since the angle is random the distance also becomes random, and we should therefore be able to substitute the calculation for a die-roll table instead.
Cheers!
Cheers!
Tom Kalbfus
Mongoose
Here is my start on the stats for the Space Colonies orbiting Earth, the space around Earth is the most densely populated, the chart blow deals with the lowest orbit I hope you can understand the stats. I am using the spaceport letters from the Classic Traveller Scout book. The 2 letter-number designation in front refers to the coordinate system identifying each colony I have not yet named.

Tom Kalbfus
Mongoose
I was randomly determining the positionin orbit, the actual distance is circumscribed by the orbit the planet is in and the orbit your coming from. the calculation is not hard if you have a calculator with trig functions Sin and Cos.Sketchy said:Thanks Tom! However, I meant a die roll for the whole distance so that I don't need to do any (or only minimal) calculations. Since the angle is random the distance also becomes random, and we should therefore be able to substitute the calculation for a die-roll table instead.
Cheers!
Tom Kalbfus
Mongoose
I think I will have to eliminate some of these, there are just too many, and I want to stick to one table per chart, and I'll need space on the map to put down the names of each of these space colonies, once I think of them.Tom Kalbfus said:Here is my start on the stats for the Space Colonies orbiting Earth, the space around Earth is the most densely populated, the chart blow deals with the lowest orbit I hope you can understand the stats. I am using the spaceport letters from the Classic Traveller Scout book. The 2 letter-number designation in front refers to the coordinate system identifying each colony I have not yet named.
Tom Kalbfus said:I think I will have to eliminate some of these, there are just too many, and I want to stick to one table per chart, and I'll need space on the map to put down the names of each of these space colonies, once I think of them.
Who are you and what have you done with the real Tom Kalbfus? :twisted:
Also, you're going to tell me that you're actually rolling dice and writing these down by hand, aren't you. You really seem absolutely determined to present these in the most inefficient way possible - why not just put it all in a comma-separated text file and upload that?
Tom Kalbfus
Mongoose
Formatting is everything! One of the reasons I present the data in jpg format is because I can arrange it however I want, and don't have to worry about the text editor eating my white space and ruining my columns. In this case I already filled one page with stats, I think the best course would be to keep the stats, and simply reassign them to different colonies after eliminating 75% of them on the map, that way I would have room for labels. I also need to change the sizes of certain colony types. A Bernal Sphere for instance is designed to house 10,000 people, in colony ME the stats are HSph632-8, the 6 indicates a population in the millions.fusor said:Tom Kalbfus said:I think I will have to eliminate some of these, there are just too many, and I want to stick to one table per chart, and I'll need space on the map to put down the names of each of these space colonies, once I think of them.
Who are you and what have you done with the real Tom Kalbfus? :twisted:
Also, you're going to tell me that you're actually rolling dice and writing these down by hand, aren't you. You really seem absolutely determined to present these in the most inefficient way possible - why not just put it all in a comma-separated text file and upload that?


This is the Bernal Sphere exterior and interior, it is designed to hold 10,000 people, or a population of 3, 10,000 being the top range. I quote from the NSS site:
If the habitat is a mile in circumference that means it is 0.3183 of a mile in diameter or 512 meters if you prefer. A population of 6 indicates that it can hold up to 10,000,000 people. The Bernal Sphere in this case would have to have 1000 times the surface area. If we multiply the diameter by 31.62, which is the square root of 1000 we get a diameter of 10.065 miles and would rotate once every 4.256 minutes to produce 1-gravity at its interior equator the central axis is about 5 miles up, in comparison, Mount Everest is 5 miles in altitude, but since gravity diminishes in inverse proportion to the distance from the central axis, the atmospheric pressure would be the equivalent to 2.5 miles in altitude if it was at sea level pressure at the equator. Climbing up the walls of this sphere would be the equivalent of climbing a mountain half as high as Mount Everest but with a much better view. Distances would be 31.62 times that in a standard Bernal, since it orbits at a radius of 8,500 miles, its orbital period would be way too short to get uninterrupted sunshine for an arrangement or mirrors, so sunlight is produced artificially instead with an arrangement similar to a Kalpana Space Colony.The habitat design shown here, made visual by NASA artist R. Guidice, is known as a "Bernal Sphere." Houses, lawns, trees, people, and all – a community of some 10,000 people – rest upon the interior surface of a large sphere, nearly a mile in circumference. The entire sphere rotates at about 1.9 RPM, producing centrifugal force as a substitute for gravity. At the equator, this simulated "gravity" is of about Earth-normal intensity. Away from the equator, it tapers off, diminishing gradually to zero at the poles. This offers the inhabitants some unusual recreational opportunities: human-powered flight, for example, and zero-gravity sports.

Imagine this exterior but on a sphere instead of a cylinder, energy is beamed to it from a Solar Power Satellite, or could possibly be supplied by an interior fusion reactor. Light comes from a strip as you see in the second image, but instead of it being a window to let in reflected light, it is an artificial light source. I would suggest lasers. Lasers can easily achieve the light intensity of the Sun, and by combining laser light of different colors, we can reproduce natural sunlight for the interior of the colony, we can even make it appear to come from a disk within that strip that looks like the Sun, or if we want, at night, we can reproduce a much dimmer image of the Moon or the Earth if desired.
So we would vary the size by population with a minimum size of 0.3183 miles for a population code of 3
population code
3 = 0.3183 miles
4 = 1 mile
5 = 3.16 miles
6 = 10 miles
7 = 31.6 miles (One would need a pressure suit to ascend to the central axis of this sphere, equivalent to 7.5 miles in altitude)
Tom Kalbfus
Mongoose
This is the Island Three or O'Neill Cylinder as its often called.
This will give a sense of the scale, and how the Sun appears to move as the day advances.
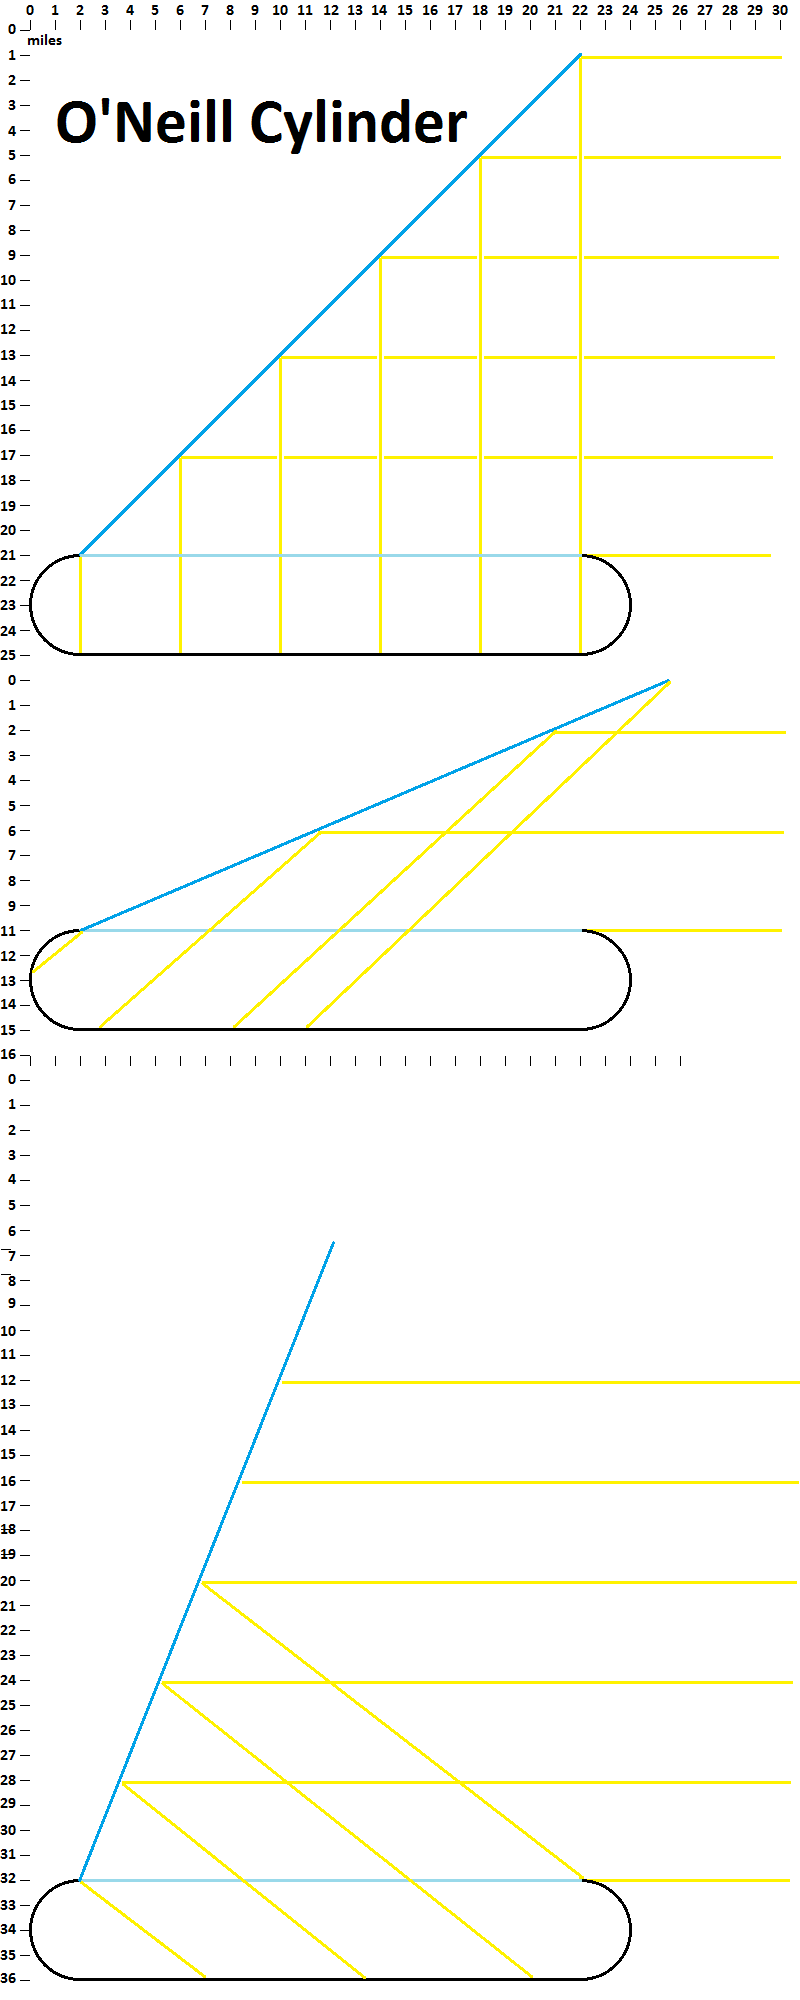
The end of the mirror experiences 13.5-Gs in the bottom diagram, obviously the mirrors have to be made of very strong and light weight material, probably carbon composites with a coat of aluminum on it.
This will give a sense of the scale, and how the Sun appears to move as the day advances.
The end of the mirror experiences 13.5-Gs in the bottom diagram, obviously the mirrors have to be made of very strong and light weight material, probably carbon composites with a coat of aluminum on it.
Tom Kalbfus
Mongoose
I think when the mirrors are at 90 degrees to the O'Neill cylinders, that will be night. The length of the cylinders minus the end caps are 20 miles, the length of the mirrors are 28.2843 miles or the square root of 800 miles to be precise, that is so when the mirror is at a 45 degree angle it illuminates the entire 20 mile long valley on the opposite side of the cylinder. There are a series of cables connecting the mirrors to the cylinder. When the winches reel in the cables, the mirrors are pulled toward the cylinder, an residents living in the cylinder get a sunrise, and the sun shines through the window in the sky opposite their valley, the winches slowly reel in the cables towards the windows on the outside of the cylinder, and the Sun proceeds to advance towards the high noon position, which is the top diagram. During the morning, the north endcap is illuminated as you see in the bottom diagram, the top diagram shows the high noon position of the mirror, and past that the middle diagram shows the afternoon position, where the south end cap gets illuminated, after spending some time in that position, At around 5:00 pm, the winches slowly release the cables and the mirrors straighten out back towards the 90 degree position that represents night, along the way the Sun reaches a second high noon position, and then sets towards the southern portion of the window, back where it came and then the valley opposite darkens for night, and the stars wheel around the cylinder as seen through the opposite window. You see the agro-cylinders in the preceding illustration before mine?, those will be at a radius of 36 miles, so they won't block the light received by the three primary mirrors reflecting light into the habitation cylinder. This whole thing is paired with another Cylinder 72 miles away with another ring of agro-cylinders supporting it and its own set of three flat primary mirrors reflecting light into the Cylinder, the other Cylinder rotates in the opposite direction from its mate. Both Cylinders are oriented so that their north end caps are facing the Sun, the total maximum population for this colony is around 20 million people. in Traveller terms this is population up to 6 for each cylinder, and into low 7 if you consider both cylinders at once.
Similar threads
- Replies
- 65
- Views
- 22K
- Replies
- 0
- Views
- 5K
- Replies
- 25
- Views
- 15K